◄ Back to Blood Service in Brief October 2016
The Blood Service’s figures for red cell demand and supply in Australia for the past financial year show both encouraging and challenging trends.
In 2015/16 we supplied 646,014 units of red blood cells to health providers across Australia. Through our continuing work to improve forecasting accuracy and closely align collections and inventory with demand we improved on several key measures. Of the red blood cells supplied, 98 per cent of orders were Delivered in Full and On Time, an improvement of 1.2 per cent over the previous year, and our average product age at issue reduced from 6.95 days to 6.85 year-on-year. In 2015/16 our red blood cell demand forecast accuracy was 97.4 per cent.
Red cell reduction slows
As expected, overall national red cell demand continued to decline in 2015/16. Although this year’s drop of 3.4 per cent was still a reduction, the decline itself was less than in 2013/14 and 2014/15, which saw drops of 7.9 and 5.0 per cent respectively. Overall, this represents a softening of the red cell demand decline trend seen over the past few years, and we forecast a smaller 2.8 per cent decline in 2016/17.
Patient Blood Management strategies, improvements in surgical techniques, wastage reduction (including redistribution of blood components within AHP networks) and budget visibilities, such as devolved budgets within the public sector, are all contributing to reducing demand for red cells.
Red cell issues per 1,000 population declined nationally year-on-year, from 27.93 to 26.51.
O negative demand up
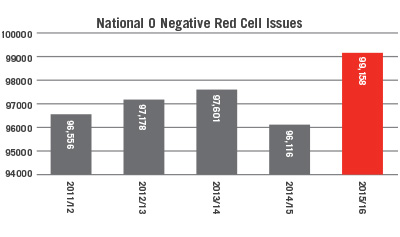
In contrast to the fall in overall red cell demand, the national demand for O negative red cells rose again in 2015/16. While order numbers for all other types of red cells fell, the actual number of O negative units ordered in Australia rose by 3,042 to 99,158.
This caused the proportion of O negative orders to increase 3.2 per cent to its highest-ever average level of 15.3 per cent. This is higher than the average across a number of blood services and centres in the USA, Canada, Ireland, Israel, and the UK. An international study from 2014 found that these countries had an average O negative distribution as a proportion of all red cells of 11.15 per cent.*
Alongside this increased demand, recorded customer discards of O negative units were 6.2 per cent, above the O positive rate of 2.1 per cent.
To meet this demand, Blood Service red cell collections were 15.1 per cent O negative over in 2015/16. As only 9 per cent of the Australian population is O negative, this growing imbalance between supply and demand presents a challenge. This means that currently O negative whole blood donors donate at a higher average frequency, 1.5 times per year, compared to 1.2 times yearly for all donors.
AB, B positive down
Figures from the past year show that groups B positive and AB positive had the biggest demand declines, falling 9.7 and 32.9 per cent respectively. As with O negative, this creates its own challenges. The Blood Service will continue to work to balance collection with demand in order to maintain appropriate stocks of red cells and whole blood-derived AB cryoprecipitate.
Overall, though, despite some ups and downs in demand, the improvements in red cell DIFOT results are great news for our customers, showing that the Blood Service continues to improve our ability to deliver the right products at the right time.
*‘Changes in blood center red blood cell distributions in the era of patient blood management: the trends for collection (TFC) study.’ Transfusion, 24 Aug 2016. http://www.ncbi.nlm.nih.gov/pubmed/27339776